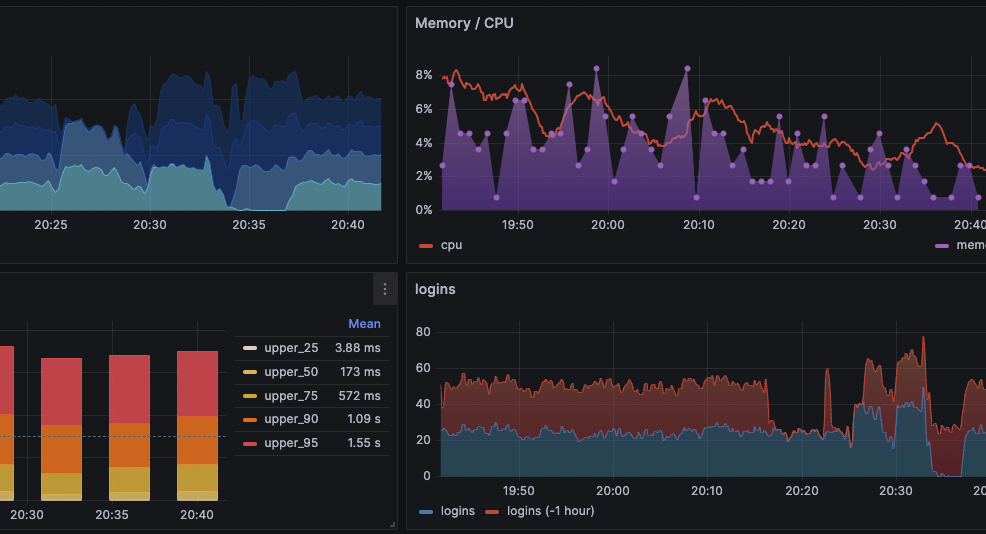
Grafana is an open-source data visualization and monitoring tool that allows users to create dashboards and panels to display data from various sources in a user-friendly and interactive manner. It supports a wide range of data sources including popular databases like MySQL, PostgreSQL, and Microsoft SQL Server, as well as cloud-based services like Amazon Web Services, Google Cloud, and Microsoft Azure.
Grafana also provides various visualization options, including graphs, tables, and gauges, which can be customized and arranged to suit individual preferences. With its intuitive interface and powerful features, Grafana is widely used by developers, system administrators, and data analysts to monitor and analyze their systems and applications.

Grafana MySQL Configuration: Step-by-Step
- Install and configure MySQL/MariaDB: If you haven’t already, you will need to install and configure MySQL on your system. Make sure that you have the necessary permissions to access the database.
- Install Grafana: Download and install Grafana on your system. You can find the latest version on the official Grafana website.
- Launch Grafana: Once Grafana is installed, you can launch it by starting the Grafana server. You can do this by running the following command in the terminal:
sudo systemctl start grafana-server- Log in to Grafana: Once the server is running, open a web browser and navigate to http://localhost:3000. This will take you to the Grafana login page. Log in with your credentials. If this is your first time logging in, the default username and password are both ‘admin’.
- Add a data source: After logging in, you will be taken to the Grafana dashboard. From there, click on the gear icon in the left-hand sidebar, and then click on “Data Sources”.
- Choose MySQL: In the “Data Sources” page, click on the “Add data source” button. From the list of available data sources, choose MySQL.
- Configure MySQL settings: In the MySQL configuration page, you will need to enter the following information:
- Name: A name for your data source.
- Host: The hostname or IP address of your MySQL server.
- Database: The name of the MySQL database you want to connect to.
- User: The MySQL user you want to use to connect to the database.
- Password: The password for the MySQL user.
- Test the connection: After entering the necessary information, click on the “Save & Test” button to test the connection to your MySQL database. If the connection is successful, you will see a green message that says “Data source is working”. If not, double-check the configuration settings and try again.
- Use MySQL in Grafana: Once the connection is established, you can start creating dashboards and panels using the data from your MySQL database. To do this, simply create a new dashboard or panel, and then choose the MySQL data source you just added.
That’s it! You should now be able to connect Grafana to your MySQL database and start visualizing your data.

